Accurate assessment of food intake remains a critical problem in nutrition research, which has spurred research into potential biomarkers that are objective and accurate. The search has expanded to metabolites found in feces, and early work has found biomarkers that are predictive of individual food intakes. These potential biomarkers could be complementary of other biomarkers and sample collection can be performed in a non-invasive manner. Work by Shinn and colleagues reported in the December 2022 issue of The Journal of Nutrition further evaluates fecal metabolite profiles to identify biomarkers associated with the intake of specific foods.
Fecal samples collected from 5 controlled feeding studies designed to determine the effect of specific foods (almonds, avocados, broccoli, walnuts, barley, and oats) on fecal microbiota were used for the analyses. Changes in the 96 metabolites remaining after elimination of metabolites for which insufficient data were available were used to assess the relationship between those metabolites and foods consumed, as well as to rank the predictive power of the metabolites.
Random forest models created for each food revealed prediction accuracies between 47 and 89%. Comparison of the data for each food indicated an ability to differentiate walnut intake from almond intake (91% accuracy). These observations led the authors to conclude that fecal metabolites may be an objective set of biomarkers that complement self-reported food intake estimates. They suggest more work is necessary to explore the functionality of fecal metabolites for other foods at differing doses and within varied dietary patterns in order to identify those biomarkers that may be applicable in feeding study compliance and clinical settings.
In an editorial, Frankenfeld reiterated that the work by Shinn and colleagues was most effective for almonds and walnuts, but performed poorly for avocado, broccoli, barley, and oats. However, Frankenfeld suggested fecal biomarkers could be used for compliance with dietary interventions and to determine interindividual variation in nutrient metabolism. Further work was recommended to determine the conditions under which fecal biomarkers are most effective, especially in the context of observational studies with complex dietary patterns.
References
Shinn LM, Mansharamani A, Baer DJ, Novotny JA, Charron CS, Khan NA, et al. Fecal metabolites as biomarkers for predicting food intake by healthy adults. Journal of Nutrition , Volume 152, Issue 12, December 2022, Pages 2956-2965. https://doi.org/10.1093/jn/nxac195.
Frankenfeld CL. Fecal metabolome: New addition to the toolbox for dietary assessment? Journal of Nutrition, Volume 152, Issue 12, December 2022, Pages 2643-2644. https://doi.org/10.1093/jn/nxac233.
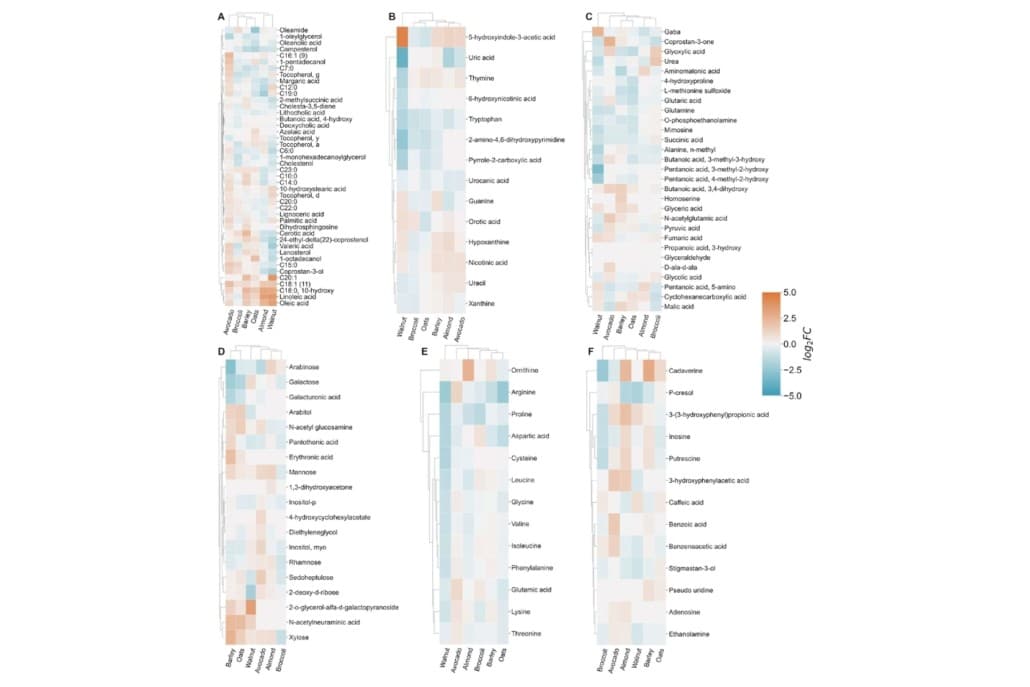
FIGURE 1 (Featured Image) Heat maps of log-fold change between mean differences of relative concentrations of fecal metabolites in metabolically healthy adult participants consuming almond, avocado, broccoli, walnuts, and whole grains. (A) Lipids and lipid-like molecules, (B) organoheterocyclic compounds, (C) other organic acids and derivatives, (D) organic oxygen compounds, (E) amino acids, and (F) other metabolites. Postintervention metabolites were subtracted from the preintervention data to compute the net effect of the control and treatment interventions for each participant (n = 181). Log-fold change ratios were then computed for each metabolite’s mean difference in each treatment group with respect to the corresponding control group. Orange boxes indicate an increased fold change from pre- to postintervention, whereas blue boxes indicate a decreased fold change. The darker the color, the higher the magnitude of change is for that metabolite. The dendrogram (black bars) was generated using a Euclidean distance metric for both study groups and the individual metabolites. Bars across the top and y axis show how variables cluster together. Items that are in the same cluster are more similar (i.e., across the top, hierarchical clusters show which foods have similar patterns of fold change across the metabolite; across the y axis, the clusters show which metabolites have similar patterns of fold change across the food groups).